> ## Documentation Index
> Fetch the complete documentation index at: https://bunnynet-cb9733c2-claude-slack-session-favglo.mintlify.site/llms.txt
> Use this file to discover all available pages before exploring further.
# Monitoring
> Understanding how your application behaves in real time is essential for making informed decisions, identifying performance bottlenecks, and delivering a seamless user experience. Magic Containers provides robust monitoring features, allowing you to gain deep insights into various aspects of your application's performance.
# What you'll need
Before you dive in, make sure you have the following prerequisites in place:
* A [bunny.net](https://bunny.net/) account ([Log in](https://dash.bunny.net/auth/login?pk_buttonlocation=menu) or sign up for a [free trial](https://dash.bunny.net/auth/register)).
* Ensure that you have **already deployed the application** you want to monitor.
# Accessing app monitoring
To access the App Monitoring feature, follow the steps below:
1. Login to [bunny.net dashboard](https://dash.bunny.net/auth/login?pk_buttonlocation=menu).
2. Navigate to the **Magic Containers** section and select the app you want to monitor.
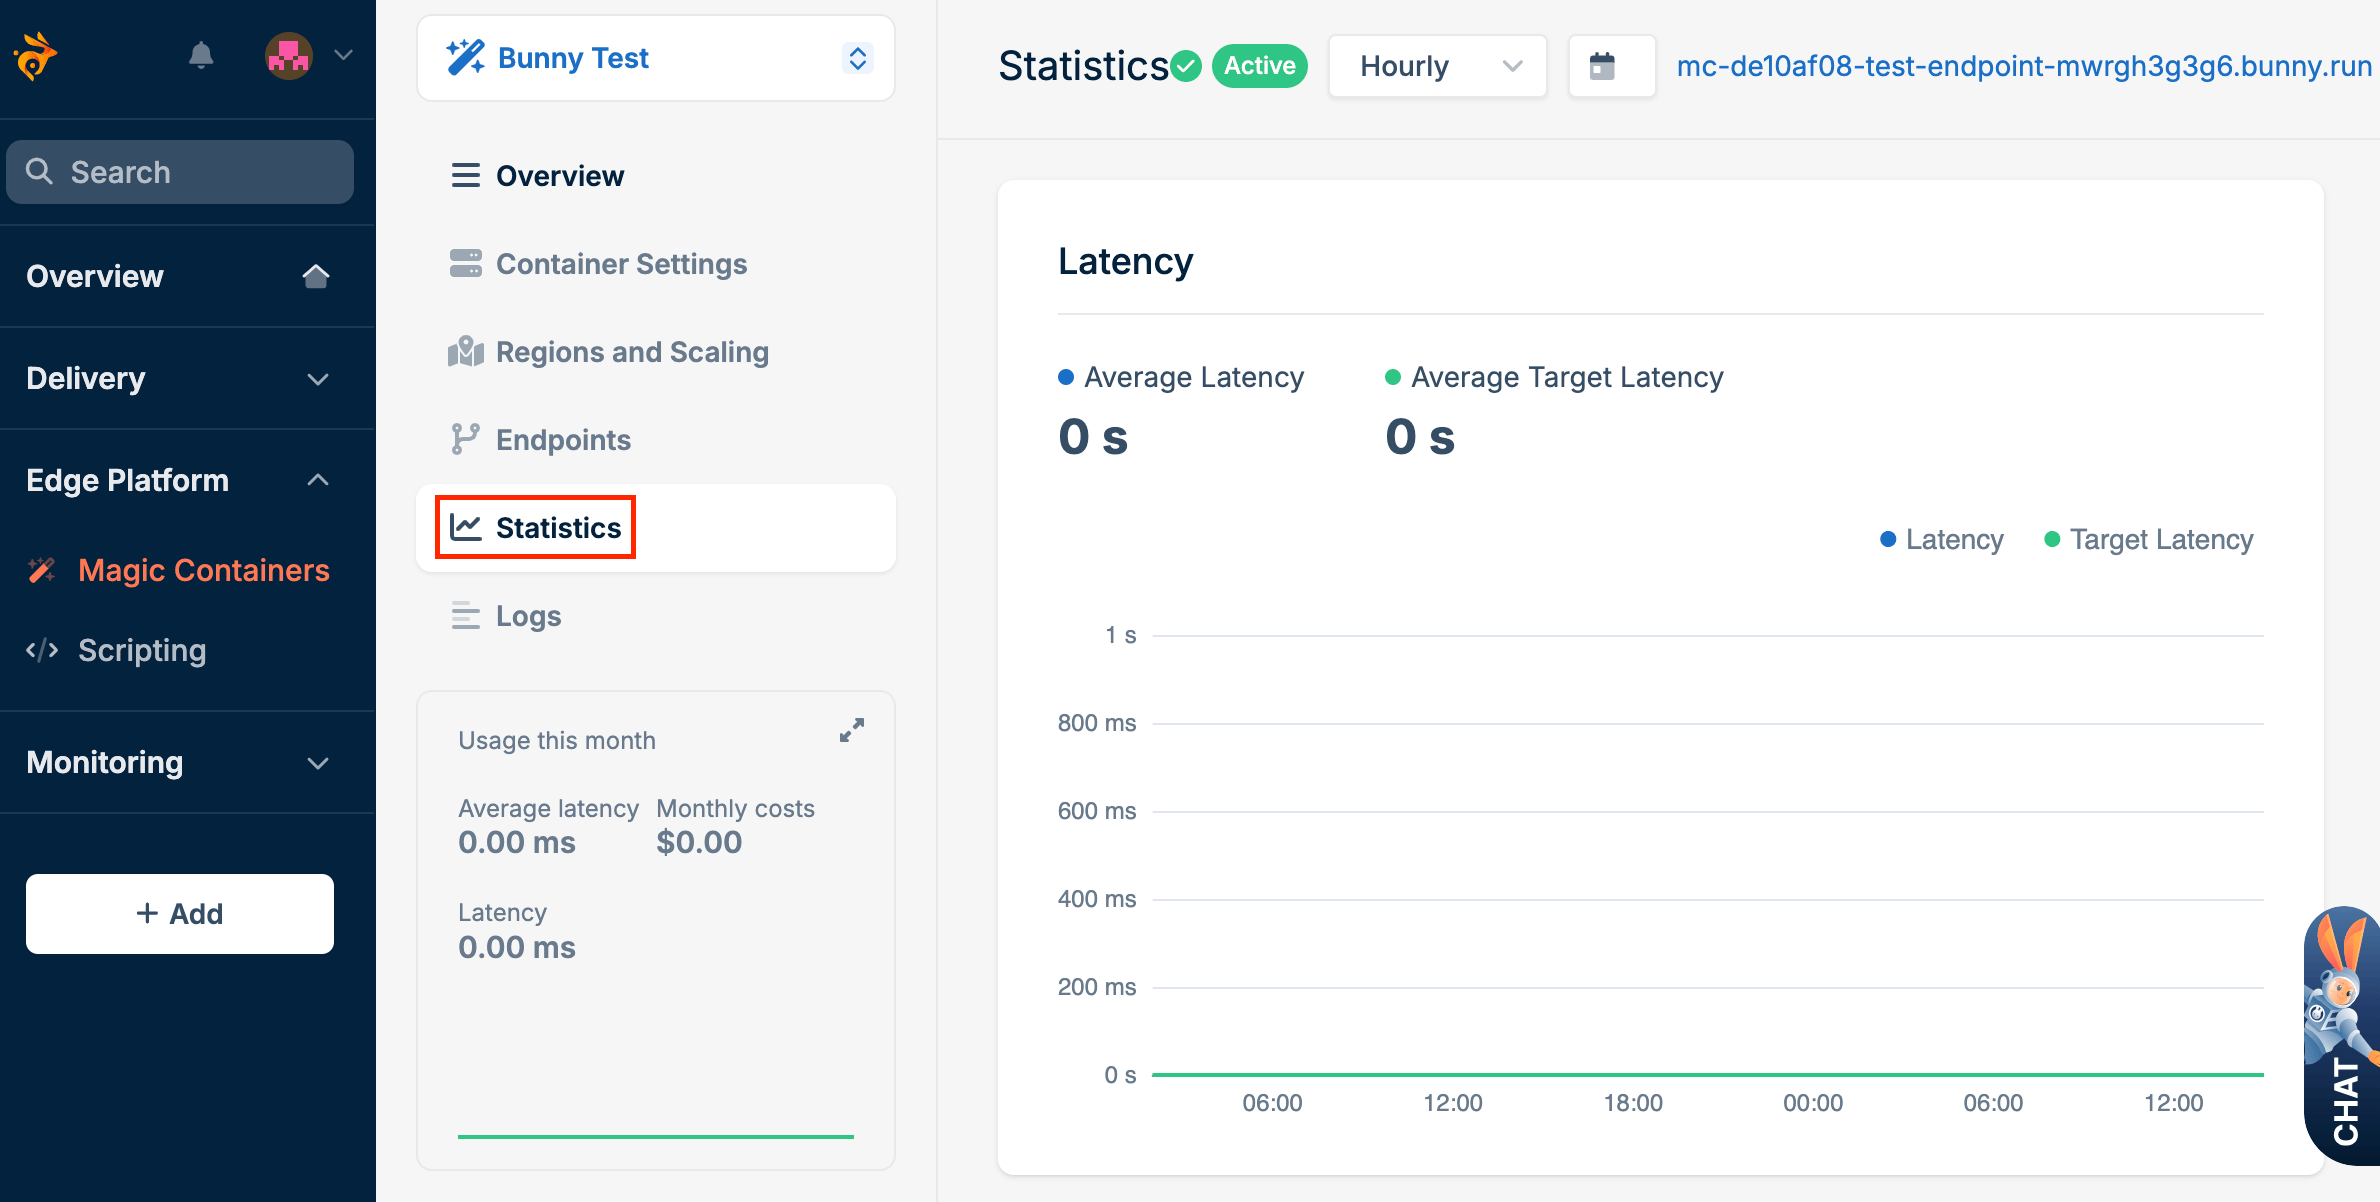
3. Once you've selected your app, click the **Statistics** tab to access detailed insights into its performance.
 # Available metrics
The Statistics tab provides a range of metrics that give you a comprehensive view of your application's behavior. Here are the key metrics available:
* **Latency**: Latency measures the time it takes for a request to travel from the source to the destination and receive a response. In the context of Magic Containers, it indicates the responsiveness of your application.
* **Instances and active regions**: This metric provides insights into the number of instances running your application and the active regions where these instances are distributed.
* **Traffic served**: This measures the amount of data served by your application, providing insights into its overall usage.
* **CPU usage**: Shows the processing power your application consumes, measured **relative to your application's CPU limit** rather than as an absolute number of cores. On the [dynamic runtime](/magic-containers/limits), that limit is 8 CPUs, so a reading represents utilization against all 8 CPUs: `100%` corresponds to the full 8-CPU limit and `12.5%` corresponds to a single full core. To convert a reading into absolute cores, multiply it by the CPU limit — for example, `cores = CPU usage (%) ÷ 100 × 8`. The value is averaged over the selected time window, so short bursts can push it well above the container's steady-state usage.
* **Memory usage**: Tracks the memory consumption of your application as an **absolute value** (for example, in MB), highlighting its memory usage patterns.
CPU usage is scaled to your application's CPU limit, while **memory usage is reported as an absolute value**. If you compare CPU usage directly against the number of cores you measure from inside your container, it will look higher — for example, roughly 12.5× higher on the dynamic runtime — because it is expressed as a percentage of the 8-CPU limit rather than as raw cores.
This metric is intended for monitoring and is **not** the basis for billing. Billing is calculated separately from the actual CPU time (CPU-seconds) your containers consume, so it is unaffected by how CPU usage is scaled here. See [Pricing](/magic-containers/pricing) for details.
# Configuring display options
# Available metrics
The Statistics tab provides a range of metrics that give you a comprehensive view of your application's behavior. Here are the key metrics available:
* **Latency**: Latency measures the time it takes for a request to travel from the source to the destination and receive a response. In the context of Magic Containers, it indicates the responsiveness of your application.
* **Instances and active regions**: This metric provides insights into the number of instances running your application and the active regions where these instances are distributed.
* **Traffic served**: This measures the amount of data served by your application, providing insights into its overall usage.
* **CPU usage**: Shows the processing power your application consumes, measured **relative to your application's CPU limit** rather than as an absolute number of cores. On the [dynamic runtime](/magic-containers/limits), that limit is 8 CPUs, so a reading represents utilization against all 8 CPUs: `100%` corresponds to the full 8-CPU limit and `12.5%` corresponds to a single full core. To convert a reading into absolute cores, multiply it by the CPU limit — for example, `cores = CPU usage (%) ÷ 100 × 8`. The value is averaged over the selected time window, so short bursts can push it well above the container's steady-state usage.
* **Memory usage**: Tracks the memory consumption of your application as an **absolute value** (for example, in MB), highlighting its memory usage patterns.
CPU usage is scaled to your application's CPU limit, while **memory usage is reported as an absolute value**. If you compare CPU usage directly against the number of cores you measure from inside your container, it will look higher — for example, roughly 12.5× higher on the dynamic runtime — because it is expressed as a percentage of the 8-CPU limit rather than as raw cores.
This metric is intended for monitoring and is **not** the basis for billing. Billing is calculated separately from the actual CPU time (CPU-seconds) your containers consume, so it is unaffected by how CPU usage is scaled here. See [Pricing](/magic-containers/pricing) for details.
# Configuring display options
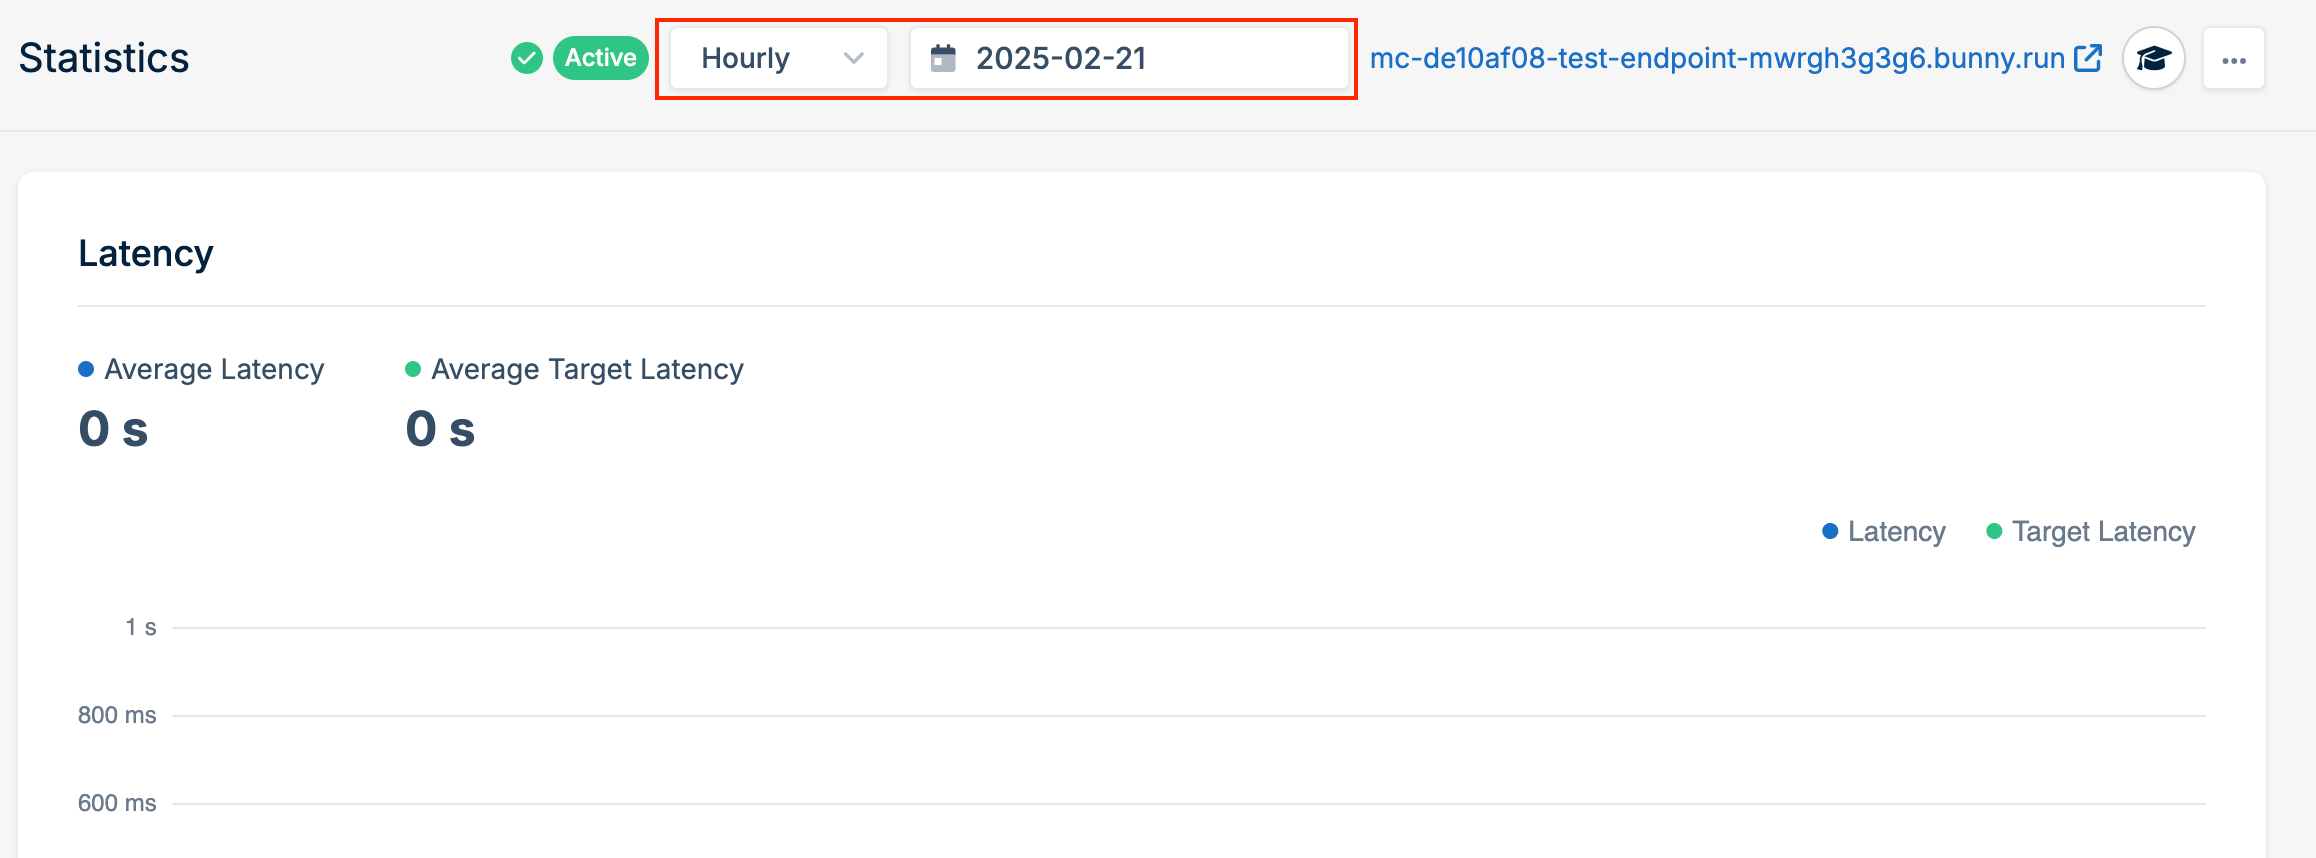 Effectively utilizing Magic Containers' monitoring tools involves tailoring the display to meet your specific analysis needs. Customize the display options to focus on the metrics and timeframes that matter most to you.
## Time Period
Effectively utilizing Magic Containers' monitoring tools involves tailoring the display to meet your specific analysis needs. Customize the display options to focus on the metrics and timeframes that matter most to you.
## Time Period
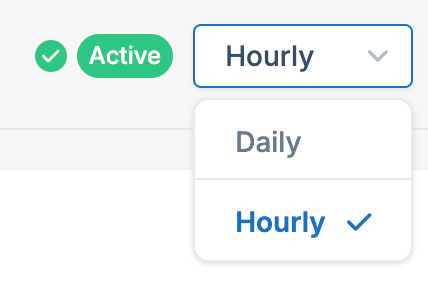 You can toggle between daily and hourly statistics to analyze trends over different timeframes. This flexibility helps you identify patterns and trends in your application's behavior.
## Date Selection
You can toggle between daily and hourly statistics to analyze trends over different timeframes. This flexibility helps you identify patterns and trends in your application's behavior.
## Date Selection
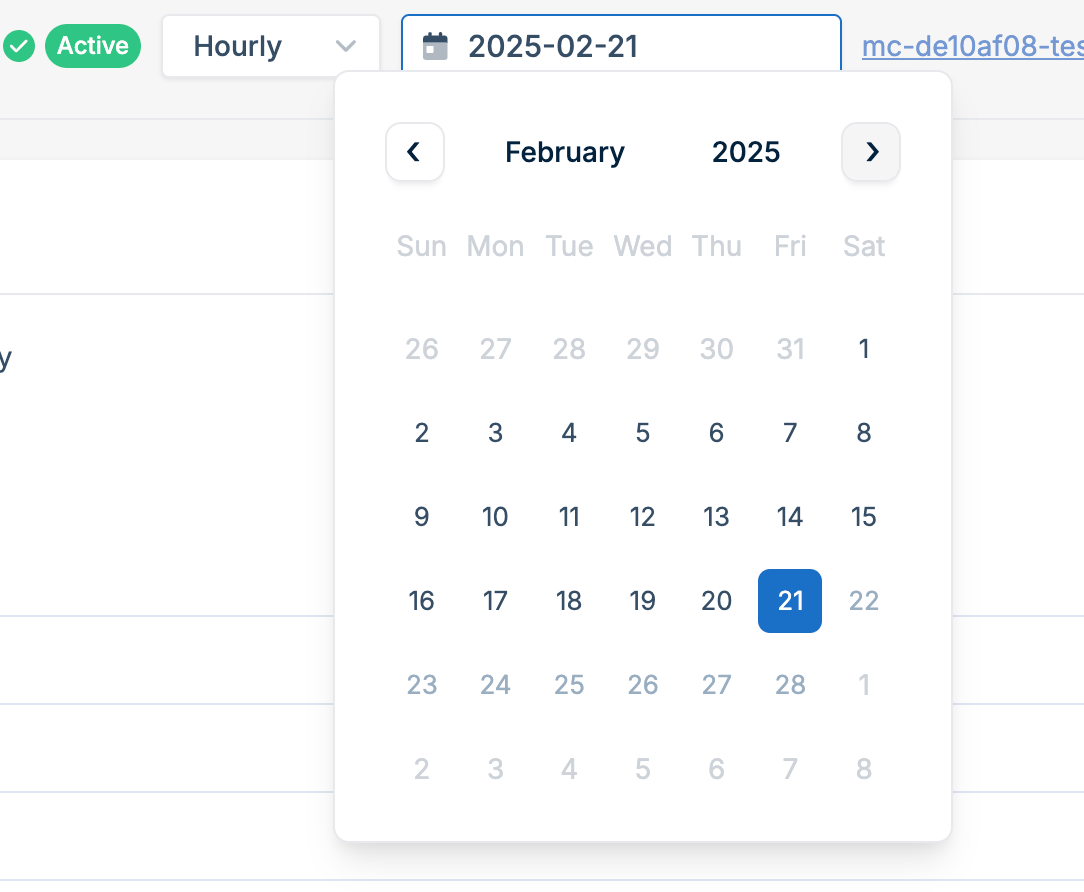 Select a specific date to focus on particular periods, facilitating a detailed analysis of your application's historical performance.